Memcached Doesn't Work the Way You Think It Does
A coworker strolled over to my desk late on a Thursday afternoon and casually mentioned that one of our internal tools was unresponsive. On investigation I discovered that the box was getting hammered with requests, under normal circumstances this machines receives 1 RPM (requests/minute) but was currently receiving 1200 RPM.
In this case we started looking at our caching code and the Memcached pool. There were no graphs or alerts that showed anything odd. In our case each Memcached instance was configured to use 4Gb of memory but only 1Gb of memory was being used according to Memcached’s internal bytes statistic. The large number of requests pointed to an empty cache, but nothing in the code indicated what could be causing it. So we ran a few tests and found some troubling results.
>> Rails.cache.write("phil_test_key", JSON.parse(result.http_response.body), :expires_in => 1.day)
=> true
>> 100.times do |i|
?> break if Rails.cache.read("phil_test_key", :raw => true).nil?
>> puts "#{i} seconds"
>> sleep 1
>> end
0 seconds
1 seconds
...
12 seconds
13 seconds
=> nil
The object we were storing after parsing the JSON and marshalling was roughly 28K. When we decreased the size of the object to 25K the problem disappeared. When we increased the size to 33K the problem disappeared. The quick and dirty solution therefore was to add 5K of junk data to the service response which solved our problem for the moment. But this exposed a misunderstanding on how Memcached was working behind the scenes and a problem with how we were monitoring our caching infrastructure.
I knew our clients used hashed key names to determine which Memcached server to store the value in. But to me Memcached was just a big non-persistent key-value store with expirations. For me and most of my coworkers we treated Memcached like the following figure.
[Figure 1: Memcached Naive Understanding ]
How Memcached actually works is more complex than that, and once we understood the mechanics underneath it quickly highlighted our problem. There are three key components that one needs to understand in order to grasp the issue:
- Pages: By default 1 page == 1Mb of Memcached memory. Pages are available for allocation to slabs but once they have been allocated to a slab they can't be allocated to another slab later.
- Slabs: Each page is assigned to a slab class. A slab class has a range of data-sizes that it's responsible for storing. For example if I have some data that's 28K in size it would be stored within a slab that handles data sizes between 25K and 33K. (Exact Sizes Dependent on Configuration)
- Chunks: Each individual value is stored within a single chunk. A single slab is made up of these chunks. If 28K of data is stored in a chunk within the slab that handles data up to 33K in size, the remaining 5K is wasted.
In the figure below we show a Memcached host configured to run with 8 Mb of memory, and of which 2 Mb has already been allocated.
[ Figure 2: Memcached Host and Page Allocation ]
The figure below represents a single page which has been assigned to a slab. Within it are allocated chunks which each contain some data.
[ Figure 3: A Single Allocated Page with Allocated Chunks ]
The figure below represents a single chunk.
[ Figure 4: A Single Chunk of Data ]
In our case, all the pages had been allocated to slabs in our Memcached instance. However since pages are never reallocated we effectively had a cache where we had plenty of free space for values of some types but not others resulting in evictions. While an expiration is expected and often a useful tool for keeping data fresh. Evictions are when data is removed from the data store before it has expired and is unexpected.
When our app tried to store a 28K object, Memcached found the least recently used object in that slab, and removed it from the store. With sufficient traffic of a particular size of data we started seeing rapid evictions. Because our data was repeatedly being evicted the service responsible for generating that data was getting slammed with requests and couldn’t keep up with the heavier load.
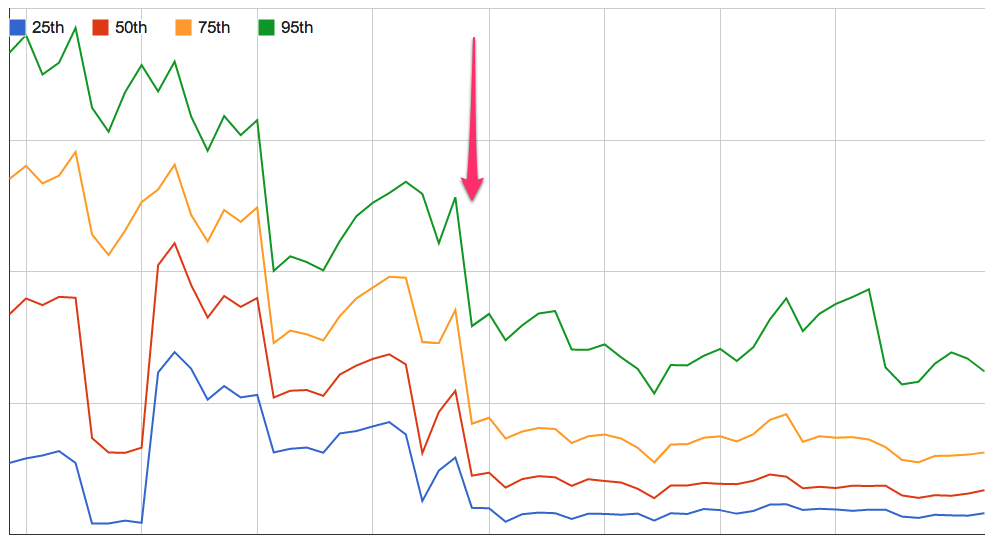
While we had already mitigated our initial problem this highlighted a much bigger issue, thousands of evictions per minute. Resulting in constant cache misses and slower performance. We restarted the Memcached instances in this pool late at night which allowed the pages to be reallocated. Here's a graph over time illustrating the drop in response time for a particular API call. As you can see it was pretty substantial.
[ Figure 5: API Response Time ]
Long term we're looking at Twemcache, a fork of Memcached, which allows more fine-grained eviction control which should keep our page allocation in balance going forward. For now we're keeping a much closer eye on our eviction rate and alerting on anything over 0.
Philip Corliss is a Cheese Enthusiast and wrote this blog post while a Software Developer at Groupon. He’s no longer working for Groupon but still loves to talk about caching and scaling problems. For cheese recommendations, adorable corgi photos, and questions please email pcorliss@gmail.com or tweet @pcorliss.
